

404 datasets found
-
City
Farmers Markets - 2012
City of Chicago —
Chicago's Farmers Markets bring more than 70 vendors selling fresh fruits, vegetables, plants and flowers to neighborhoods throughout the City of Chicago. Markets are... -
Federal
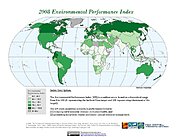
2008 Environmental Performance Index (EPI)
National Aeronautics and Space Administration —
The 2008 Environmental Performance Index (EPI) centers on two broad environmental protection objectives: (1) reducing environmental stresses on human health, and (2)... -
City
CTA - Ridership - Annual Boarding Totals
City of Chicago —
This dataset gives annual ridership totals dating to the mid-1980s. Numbers are presented in boardings (see attached readme file for information on how these numbers... -
City
Chicago Traffic Tracker - Historical Congestion Estimates by Region - 2013-2018
City of Chicago —
This dataset contains the historical estimated congestion for the 29 traffic regions, from January 2013 to May 2018. Newer records are in... -
City
CTA - Fare Media Sales Outlets - KML
City of Chicago —
Point data representing sites that sell/vend CTA Fare Media. Details include location type (ex. rail station, store) type of media sold (ex. Visitor Pass, Chicago... -
City
CTA - Bus Stops - Shapefile
City of Chicago —
Point data representing locations of CTA bus stops. See attachment below for information on STATUS and POS fields To view or use these files, compression software and... -
City
Sidewalks - KML
City of Chicago —
Sidewalks in Chicago. To view or use this KMZ file, compression software, such as 7-Zip, and special GIS software, such as Google Earth, are required. To download... -
Federal
Natural Resource Protection and Child Health Indicators, 2012 Release
National Aeronautics and Space Administration —
The Natural Resource Protection and Child Health Indicators, 2012 Release, are produced in support of the U.S. Millennium Challenge Corporation as selection criteria... -
Federal
EnviroAtlas - PRISM 30-Year Normal Annual Precipitation and Minimum and Maximum Temperature for Guam and the Commonwealth of the Northern Mariana Islands (CNMI) (1971–2000)
U.S. Environmental Protection Agency —
This annual data was accessed from the PRISM project website (https://prism.oregonstate.edu/normals_other/public/pacisl/grids/) and has a spatial resolution of 3... -
Federal
Domain and HWBI Scores for CWBI
U.S. Environmental Protection Agency —
Geo-located county-level domain and HWBI results calculated based on HWBI framework adaptations for the development of a U.S. Children's Well-Being Index. The file... -
City
DPD council districts shore clip - Relative % Change
City of Seattle —
This data layer references data from a high-resolution tree canopy change-detection layer for Seattle, Washington. Tree canopy change was mapped by using remotely... -
City
Open Spaces - Riverwalk
City of Chicago —
In 2009, CDOT opened the first sections of the river-level walkway from Michigan Avenue to State Street. The walkway winds under the Michigan and Wabash bridges,... -
Federal
National Criteria and Hazardous Air Pollutant Emissions Totals By Industry 2017
U.S. Environmental Protection Agency —
This dataset contains 2017 national level criteria and hazardous air pollutant emissions by North American Industry Classification System (NAICS) 2012 6-digit codes.... -
City
FY2023 Single Family Residential Units Measure
City of Austin —
FY2023 Single Family Residential Units Measure -
City
Open Spaces - Habitats
City of Chicago —
To view or use these shapefiles, compression software and special GIS software, such as ESRI ArcGIS, is required. -
County
Municipal Building Energy Usage
Allegheny County / City of Pittsburgh / Western PA Regional Data Center —
This data set contains energy use data from 2009-2014 for 139 municipally operated buildings. Metrics include: Site & Source EUI, annual electricity, natural gas... -
City
RecyclingDropoffSites
City of Chicago —
Locations in Chicago where residents can drop off recycling. For more about Recycling in Chicago, visit http://bit.ly/IcfLHr. To view or use these files outside of a... -
City
DPD council districts shore clip - Existing TC Percent
City of Seattle —
This data layer references data from a high-resolution tree canopy change-detection layer for Seattle, Washington. Tree canopy change was mapped by using remotely...
404 datasets found